Why USB LogTags are perfect for refrigerated transport
Place this temperature logger in with your shipment and it will record the temperatures experienced inside the trailer throughout the journey.
At the destination, the LogTag can be inserted into any Windows PC to download a comprehensive PDF report of the temperature data, including a colour-coded graph, giving your customer and instant confirmation of food safety.
[row][column medium=”5″]
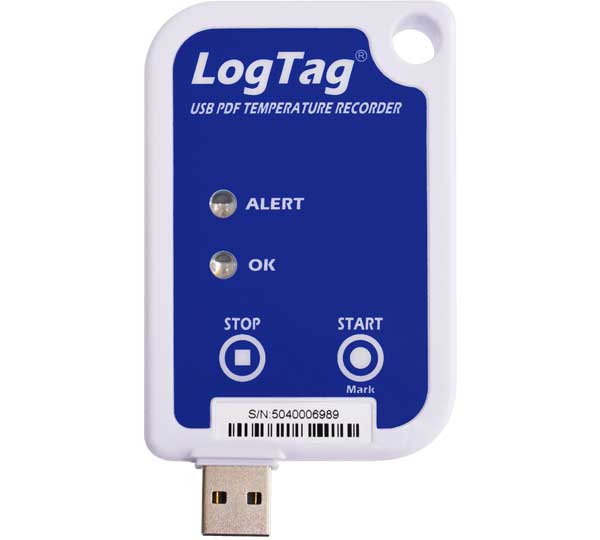
[/column][column medium=”7″]This is the LogTag model UTRIX-16.
It is 90mm high (including the USB plug) x 55mm wide – about the size of a credit card. It is made of high impact plastic and has an attractive modern design.
It has a memory capable of storing just over 16,000 readings – that’s 56 days of readings taken every 5 minutes.
It can measure temperatures from -25°C to 70°C.[/column][/row][row][column medium=”4″]
The benefits at a glance
- Instant confirmation of food safety for recipient
- Visual alert of alarm
- Wide temperature range suitable for frozen or refrigerated goods
- Inexpensive – $115+GST or less (depending on order size) per unit
- Compact, robust design
- Long battery life – units should last between 2 and 4 years
- Easy to mount in trailers – using optional plastic wall mount
- Easy to configure at base
- Large memory holds over 16,000 readings
[/column][column medium=”8″]
Easy to configure to suit your operation
No additional reader is required to use this model. Simply insert it into any free USB port on a Windows PC. The software to configure the LogTag is free to download and very easy to use. It will run on any modern Windows PC. We have easy-to-follow instructions on how to configure the logger and phone support for the life of the product.
The LogTag can be configured to record at set intervals – we recommend taking a reading every 5 minutes.
You can set a minimum and maximum temperature range. For frozen goods, we recommend setting the minimum to -25°C and the maximum to -10°C. For refrigerated goods, use a minimum of 0°C to 5°C. It is possible to have the LogTag show an alert only if the temperature is outside these ranges for a number of consecutive readings, which allows for a short fluctuation. If an alert is triggered, the red LED light on the front of the LogTag will begin to flash.
The LogTag has a STOP button on the front that ends logging. It is possible to disable this button during configuration, meaning that logging cannot be accidentally or intentionally stopped by anyone other than your admin staff.
The LogTag can be configured to stop recording when its memory is full, rather than overwriting the oldest readings. This means there is no hurry to get the LogTag back to base to download data. The data from the journey will not be overwritten.
The LogTag can be started as soon as it is configured or set to start later, either by pushing the START button or automatically at a particular date and time.[/column][/row][row]
[column]
Easy to use for admin staff and drivers
There is an optional wall mount that allows the LogTag to be placed in a convenient and consistent location inside the trailer. The mount comes with a double-sided adhesive mounting block, but could also be screwed to the trailer wall if required.
The driver can press the START/MARK button when they leave the departure point and again when the goods are delivered, as well as at any other points on the journey that the trailer was accessed.
Pressing this button will place reference mark on the graph.
At the destination, the driver can take the LogTag and place it into the customer’s PC. The LogTag will appear on the PC as a drive (like inserting a USB flash drive). The drive will have one file – a PDF report of the data – that can be copied to and viewed on the customer’s computer, giving an instant affirmation that the goods they received were in the correct temperature range for the entire journey.
Back at base, the data can be downloaded again and archived and the LogTag reset for its next assignment in under a minute.
If the LogTag is not to be used for a while, it can be “hibernated” (switched off) to prolong battery life.[/column][/row][row][column medium=”5″]

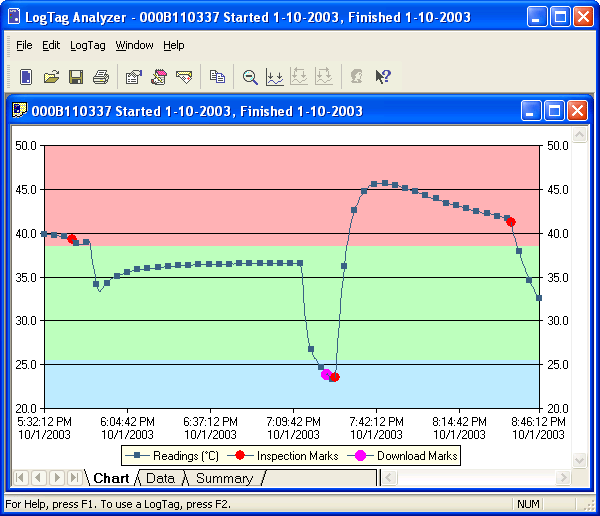
The graph shows the data in a visual format. The green is the configured temperature range (e.g. 0° to 5°). This makes it easy to see where the temperature went too high or too low. The pink dots are where the START/MARK button was pressed.[/column][column medium=”7″]
The reports
There are four parts to the report:
- Report
- A summary of temperature extremes and alerts
- Graph
- A visual representation of the data
- Data
- A spreadsheet of the data showing time and temperature
- Summary
- A summary of the LogTag configuration and journey data
[/column][/row]

